Projection pancreas data using SCALEX
The following tutorial demonstrates how to use SCALEX for integrating data and projection new data adata_query onto an annotated reference adata_ref.
There are five parts of this tutorial:
Seeing the batch effect. This part will show the batch effects of eight pancreas datasets that used in SCALEX manuscript.
Integrating data using SCALEX. This part will show you how to perform batch correction and construct a reference batch
adata_refusing SCALEX function in SCALEX.Mapping onto a reference batch using projection function. The third part will describe the usage of projection function in SCALEX to map three batches query dataset
adata_queryonto the reference batchadata_refyou construetd in part two.Visualizing distributions across batches. Often, batches correspond to experiments that one wants to compare. SCALEX v2 offers embedding function to convenient visualize for this.
Label transfer. SCALEX offers label_transfer function to conveniently transfer labels from reference datasets to query datasets.
[1]:
import scalex
from scalex import SCALEX, label_transfer
from scalex.plot import embedding
import scanpy as sc
import pandas as pd
import numpy as np
import matplotlib
from matplotlib import pyplot as plt
import seaborn as sns
[2]:
sc.settings.verbosity = 3
sc.settings.set_figure_params(dpi=80, facecolor='white',figsize=(3,3),frameon=True)
sc.logging.print_header()
plt.rcParams['axes.unicode_minus']=False
scanpy==1.6.1 anndata==0.7.5 umap==0.4.6 numpy==1.20.1 scipy==1.6.1 pandas==1.1.3 scikit-learn==0.23.2 statsmodels==0.12.0 python-igraph==0.8.3 louvain==0.7.0 leidenalg==0.8.3
[3]:
sns.__version__
[3]:
'0.10.1'
[4]:
scalex.__version__
[4]:
'0.2.0'
Seeing the batch effect
The pancreas data has been used in the Seurat v3 and Harmony paper.
On a unix system, you can uncomment and run the following to download the count matrix in its anndata format.
[5]:
# ! wget http://zhanglab.net/scalex-tutorial/pancreas.h5ad
# ! wget http://zhanglab.net/scalex-tutorial/pancreas_query.h5ad
[6]:
adata_raw=sc.read('pancreas.h5ad')
adata_raw
[6]:
AnnData object with n_obs × n_vars = 16401 × 14895
    obs: 'batch', 'celltype', 'disease', 'donor', 'library', 'protocol'
Inspect the batches contained in the dataset.
[7]:
adata_raw.obs.batch.value_counts()
[7]:
pancreas_indrop3       3605
pancreas_celseq2       3072
pancreas_smartseq2     2394
pancreas_indrop1       1937
pancreas_celseq        1728
pancreas_indrop2       1724
pancreas_indrop4       1303
pancreas_fluidigmc1     638
Name: batch, dtype: int64
The data processing procedure is according to the scanpy tutorial [Preprocessing and clustering 3k PBMCs].
[8]:
sc.pp.filter_cells(adata_raw, min_genes=600)
sc.pp.filter_genes(adata_raw, min_cells=3)
adata_raw = adata_raw[:, [gene for gene in adata_raw.var_names if not str(gene).startswith(tuple(['ERCC', 'MT-', 'mt-']))]]
sc.pp.normalize_total(adata_raw, target_sum=1e4)
sc.pp.log1p(adata_raw)
sc.pp.highly_variable_genes(adata_raw, min_mean=0.0125, max_mean=3, min_disp=0.5)
adata_raw.raw = adata_raw
adata_raw = adata_raw[:, adata_raw.var.highly_variable]
sc.pp.scale(adata_raw, max_value=10)
sc.pp.pca(adata_raw)
sc.pp.neighbors(adata_raw)
sc.tl.umap(adata_raw)
filtered out 1124 cells that have less than 600 genes expressed
normalizing counts per cell
    finished (0:00:00)
extracting highly variable genes
    finished (0:00:01)
--> added
    'highly_variable', boolean vector (adata.var)
    'means', float vector (adata.var)
    'dispersions', float vector (adata.var)
    'dispersions_norm', float vector (adata.var)
... as `zero_center=True`, sparse input is densified and may lead to large memory consumption
computing PCA
    on highly variable genes
    with n_comps=50
    finished (0:00:03)
computing neighbors
    using 'X_pca' with n_pcs = 50
    finished: added to `.uns['neighbors']`
    `.obsp['distances']`, distances for each pair of neighbors
    `.obsp['connectivities']`, weighted adjacency matrix (0:00:15)
computing UMAP
    finished: added
    'X_umap', UMAP coordinates (adata.obsm) (0:00:09)
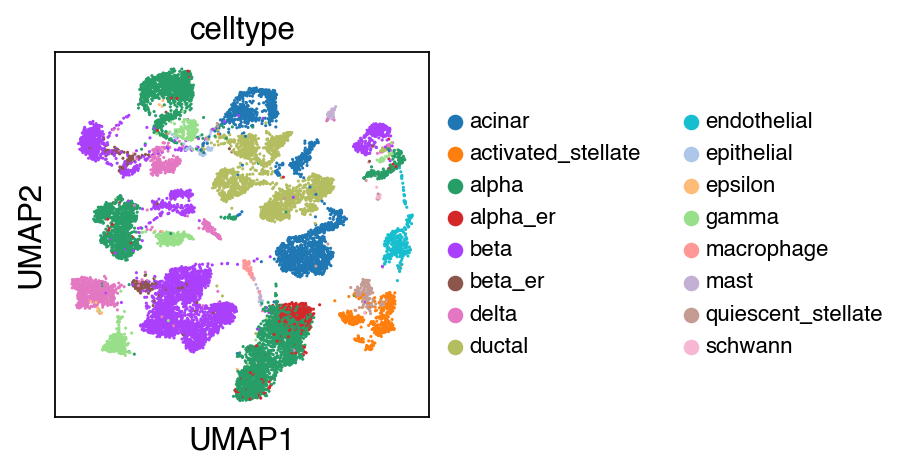
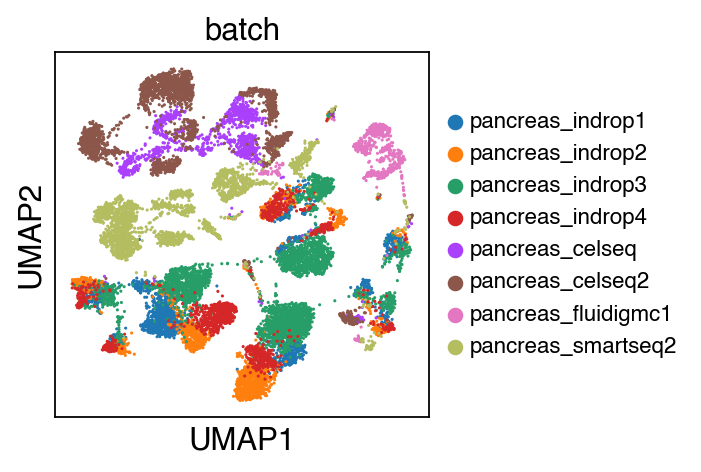
We observe a batch effect.
[9]:
sc.pl.umap(adata_raw,color=['celltype'],legend_fontsize=10)
[10]:
sc.pl.umap(adata_raw,color=['batch'],legend_fontsize=10)
[11]:
adata_raw
[11]:
AnnData object with n_obs × n_vars = 15277 × 2086
    obs: 'batch', 'celltype', 'disease', 'donor', 'library', 'protocol', 'n_genes'
    var: 'n_cells', 'highly_variable', 'means', 'dispersions', 'dispersions_norm', 'mean', 'std'
    uns: 'log1p', 'hvg', 'pca', 'neighbors', 'umap', 'celltype_colors', 'batch_colors'
    obsm: 'X_pca', 'X_umap'
    varm: 'PCs'
    obsp: 'distances', 'connectivities'
Integrating data using SCALEX
The batch effects can be well-resolved using SCALEX.
Note
Here we use GPU to speed up the calculation process, however, you can get the same level of performance only using cpu.
[12]:
adata_ref=SCALEX('pancreas.h5ad',batch_name='batch',min_features=600, min_cells=3, outdir='pancreas_output/',show=False,gpu=7)
2021-03-30 20:21:06,757 - root - INFO - Raw dataset shape: (16401, 14895)
2021-03-30 20:21:06,759 - root - INFO - Preprocessing
2021-03-30 20:21:06,785 - root - INFO - Filtering cells
filtered out 1124 cells that have less than 600 genes expressed
Trying to set attribute `.obs` of view, copying.
2021-03-30 20:21:09,107 - root - INFO - Filtering features
2021-03-30 20:21:10,607 - root - INFO - Normalizing total per cell
normalizing counts per cell
    finished (0:00:00)
2021-03-30 20:21:10,850 - root - INFO - Log1p transforming
2021-03-30 20:21:11,759 - root - INFO - Finding variable features
If you pass `n_top_genes`, all cutoffs are ignored.
extracting highly variable genes
    finished (0:00:04)
--> added
    'highly_variable', boolean vector (adata.var)
    'means', float vector (adata.var)
    'dispersions', float vector (adata.var)
    'dispersions_norm', float vector (adata.var)
2021-03-30 20:21:17,003 - root - INFO - Batch specific maxabs scaling
2021-03-30 20:21:19,528 - root - INFO - Processed dataset shape: (15277, 2000)
2021-03-30 20:21:19,566 - root - INFO - model
VAE(
  (encoder): Encoder(
    (enc): NN(
      (net): ModuleList(
        (0): Block(
          (fc): Linear(in_features=2000, out_features=1024, bias=True)
          (norm): BatchNorm1d(1024, eps=1e-05, momentum=0.1, affine=True, track_running_stats=True)
          (act): ReLU()
        )
      )
    )
    (mu_enc): NN(
      (net): ModuleList(
        (0): Block(
          (fc): Linear(in_features=1024, out_features=10, bias=True)
        )
      )
    )
    (var_enc): NN(
      (net): ModuleList(
        (0): Block(
          (fc): Linear(in_features=1024, out_features=10, bias=True)
        )
      )
    )
  )
  (decoder): NN(
    (net): ModuleList(
      (0): Block(
        (fc): Linear(in_features=10, out_features=2000, bias=True)
        (norm): DSBatchNorm(
          (bns): ModuleList(
            (0): BatchNorm1d(2000, eps=1e-05, momentum=0.1, affine=True, track_running_stats=True)
            (1): BatchNorm1d(2000, eps=1e-05, momentum=0.1, affine=True, track_running_stats=True)
            (2): BatchNorm1d(2000, eps=1e-05, momentum=0.1, affine=True, track_running_stats=True)
            (3): BatchNorm1d(2000, eps=1e-05, momentum=0.1, affine=True, track_running_stats=True)
            (4): BatchNorm1d(2000, eps=1e-05, momentum=0.1, affine=True, track_running_stats=True)
            (5): BatchNorm1d(2000, eps=1e-05, momentum=0.1, affine=True, track_running_stats=True)
            (6): BatchNorm1d(2000, eps=1e-05, momentum=0.1, affine=True, track_running_stats=True)
            (7): BatchNorm1d(2000, eps=1e-05, momentum=0.1, affine=True, track_running_stats=True)
          )
        )
        (act): Sigmoid()
      )
    )
  )
)
Epochs: 100%|██████████| 127/127 [09:11<00:00,  4.34s/it, recon_loss=266.572,kl_loss=4.667]
2021-03-30 20:30:38,361 - root - INFO - Output dir: pancreas_output//
2021-03-30 20:30:47,018 - root - INFO - Plot umap
computing neighbors
    finished: added to `.uns['neighbors']`
    `.obsp['distances']`, distances for each pair of neighbors
    `.obsp['connectivities']`, weighted adjacency matrix (0:00:03)
computing UMAP
    finished: added
    'X_umap', UMAP coordinates (adata.obsm) (0:00:10)
running Leiden clustering
    finished: found 13 clusters and added
    'leiden', the cluster labels (adata.obs, categorical) (0:00:02)
WARNING: saving figure to file pancreas_output/umap.pdf
[13]:
adata_ref
[13]:
AnnData object with n_obs × n_vars = 15277 × 2000
    obs: 'batch', 'celltype', 'disease', 'donor', 'library', 'protocol', 'n_genes', 'leiden'
    var: 'n_cells', 'highly_variable', 'means', 'dispersions', 'dispersions_norm', 'highly_variable_nbatches', 'highly_variable_intersection'
    uns: 'log1p', 'hvg', 'neighbors', 'umap', 'leiden', 'batch_colors', 'celltype_colors', 'leiden_colors'
    obsm: 'latent', 'X_umap'
    obsp: 'distances', 'connectivities'
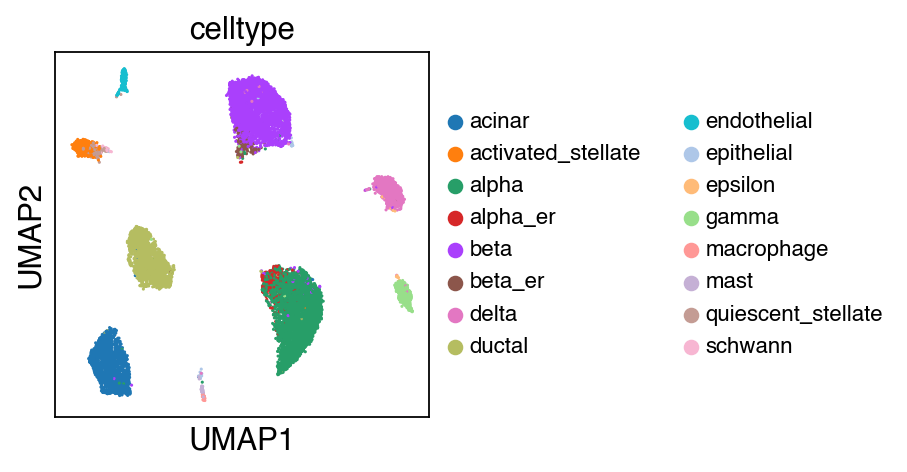
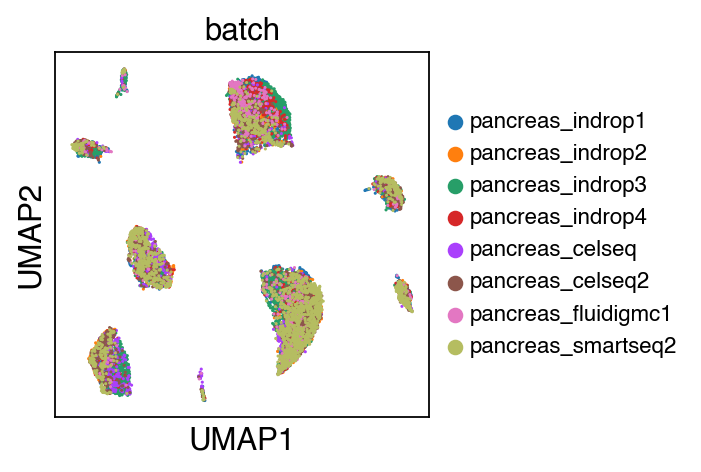
While there seems to be some strong batch-effect in all cell types, SCALEX can integrate them homogeneously.
[14]:
sc.settings.set_figure_params(dpi=80, facecolor='white',figsize=(3,3),frameon=True)
[15]:
sc.pl.umap(adata_ref,color=['celltype'],legend_fontsize=10)
[16]:
sc.pl.umap(adata_ref,color=['batch'],legend_fontsize=10)
The integrated data is stored as adata.h5ad in the output directory assigned by outdir parameter in SCALEX function.
Mapping onto a reference batch using projection function
The pancreas query data are available through the Gene Expression Omnibus under accession GSE114297, GSE81547 and GSE83139.
[17]:
adata_query=sc.read('pancreas_query.h5ad')
adata_query
[17]:
AnnData object with n_obs × n_vars = 23963 × 31884
    obs: 'batch', 'celltype', 'disease', 'donor', 'protocol'
Inspect the batches contained in adata_query.
[18]:
adata_query.obs.batch.value_counts()
[18]:
pancreas_gse114297    20784
pancreas_gse81547      2544
pancreas_gse83139       635
Name: batch, dtype: int64
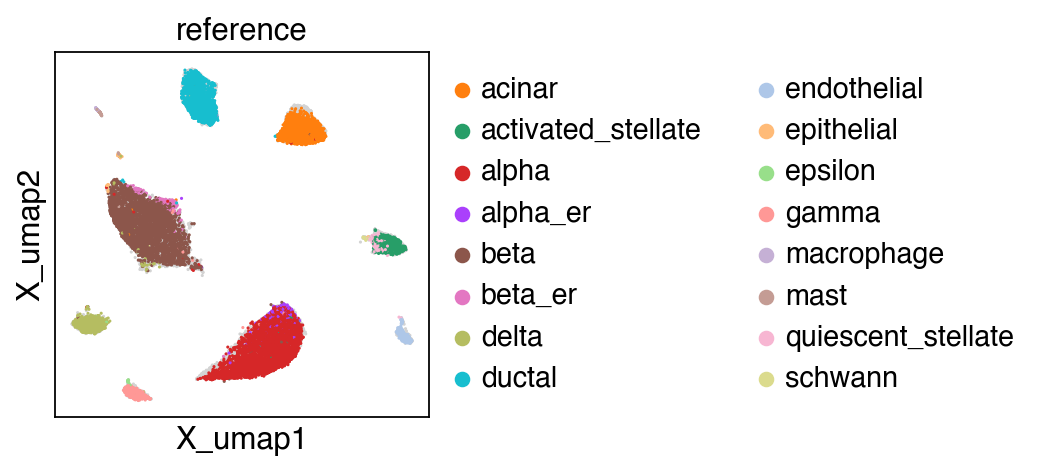
SCALEX provides a projection function for mapping new data adata_query onto the reference batch adata_ref.
[19]:
adata=SCALEX('pancreas_query.h5ad',batch_name='batch',min_features=600, min_cells=3,
             outdir='pancreas_projection/', projection='pancreas_output/',show=False,gpu=7)
2021-03-30 20:31:47,177 - root - INFO - Raw dataset shape: (23963, 31884)
2021-03-30 20:31:47,177 - root - INFO - Raw dataset shape: (23963, 31884)
2021-03-30 20:31:47,180 - root - INFO - Preprocessing
2021-03-30 20:31:47,180 - root - INFO - Preprocessing
2021-03-30 20:31:47,236 - root - INFO - Filtering cells
2021-03-30 20:31:47,236 - root - INFO - Filtering cells
filtered out 219 cells that have less than 600 genes expressed
Trying to set attribute `.obs` of view, copying.
2021-03-30 20:31:49,744 - root - INFO - Filtering features
2021-03-30 20:31:49,744 - root - INFO - Filtering features
2021-03-30 20:31:51,094 - root - INFO - Normalizing total per cell
2021-03-30 20:31:51,094 - root - INFO - Normalizing total per cell
normalizing counts per cell
    finished (0:00:00)
2021-03-30 20:31:51,430 - root - INFO - Log1p transforming
2021-03-30 20:31:51,430 - root - INFO - Log1p transforming
2021-03-30 20:31:52,607 - root - INFO - Finding variable features
2021-03-30 20:31:52,607 - root - INFO - Finding variable features
There are 2000 gene in selected genes
2021-03-30 20:31:56,488 - root - INFO - Batch specific maxabs scaling
2021-03-30 20:31:56,488 - root - INFO - Batch specific maxabs scaling
2021-03-30 20:31:59,442 - root - INFO - Processed dataset shape: (23744, 2000)
2021-03-30 20:31:59,442 - root - INFO - Processed dataset shape: (23744, 2000)
2021-03-30 20:32:04,207 - root - INFO - Output dir: pancreas_projection//
2021-03-30 20:32:04,207 - root - INFO - Output dir: pancreas_projection//
... storing 'batch' as categorical
... storing 'celltype' as categorical
... storing 'disease' as categorical
... storing 'donor' as categorical
... storing 'library' as categorical
... storing 'protocol' as categorical
... storing 'leiden' as categorical
2021-03-30 20:32:08,411 - root - INFO - Plot umap
2021-03-30 20:32:08,411 - root - INFO - Plot umap
computing neighbors
finished: added to `.uns['neighbors']`
`.obsp['distances']`, distances for each pair of neighbors
`.obsp['connectivities']`, weighted adjacency matrix (0:00:08)
computing UMAP
finished: added
'X_umap', UMAP coordinates (adata.obsm) (0:00:26)
running Leiden clustering
finished: found 13 clusters and added
'leiden', the cluster labels (adata.obs, categorical) (0:00:10)
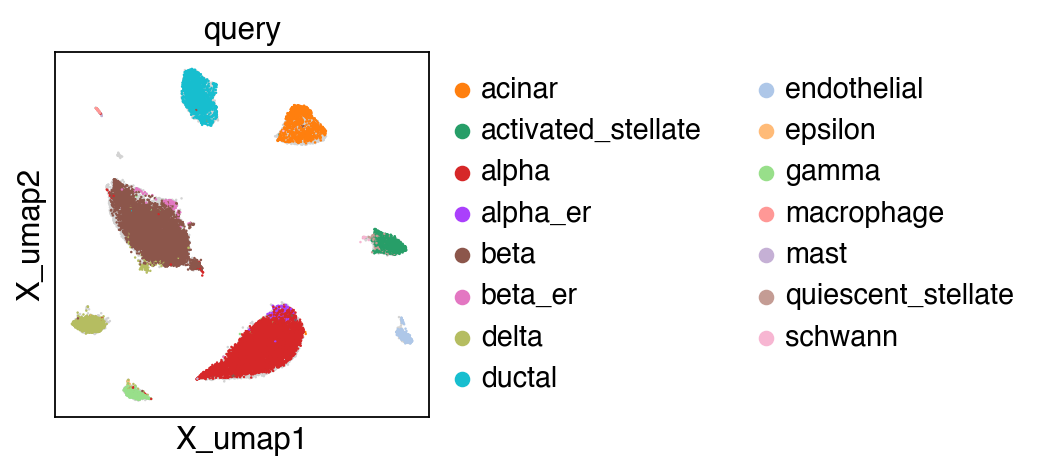
WARNING: saving figure to file pancreas_projection/X_umap_reference.pdf
WARNING: saving figure to file pancreas_projection/X_umap_query.pdf
Load integrated data adata that contained adata_ref and adata_query.
[20]:
sc.settings.set_figure_params(dpi=80, facecolor='white',figsize=(3,3),frameon=True)
[21]:
embedding(adata,groupby='projection')
[22]:
adata
[22]:
AnnData object with n_obs × n_vars = 39021 × 2000
    obs: 'batch', 'celltype', 'disease', 'donor', 'library', 'protocol', 'n_genes', 'leiden', 'projection'
    var: 'n_cells-reference', 'highly_variable-reference', 'means-reference', 'dispersions-reference', 'dispersions_norm-reference', 'highly_variable_nbatches-reference', 'highly_variable_intersection-reference'
    uns: 'neighbors', 'umap', 'leiden'
    obsm: 'latent', 'X_umap'
    obsp: 'distances', 'connectivities'
Inspect the batches contained in adata.
[23]:
adata.obs.batch.value_counts()
[23]:
pancreas_gse114297     20573
pancreas_indrop3        3605
pancreas_gse81547       2536
pancreas_celseq2        2440
pancreas_smartseq2      2394
pancreas_indrop1        1937
pancreas_indrop2        1724
pancreas_indrop4        1303
pancreas_celseq         1236
pancreas_fluidigmc1      638
pancreas_gse83139        635
Name: batch, dtype: int64
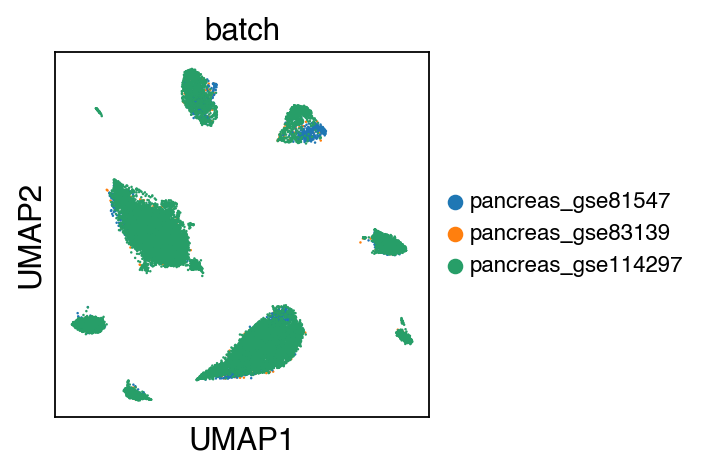
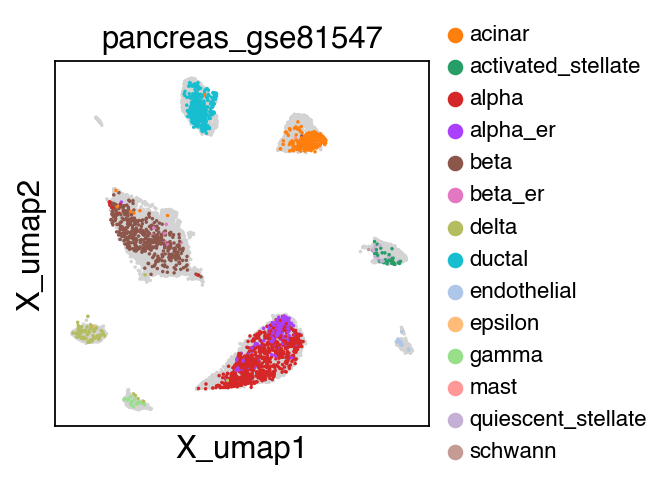
Visualizing distributions across batches
[24]:
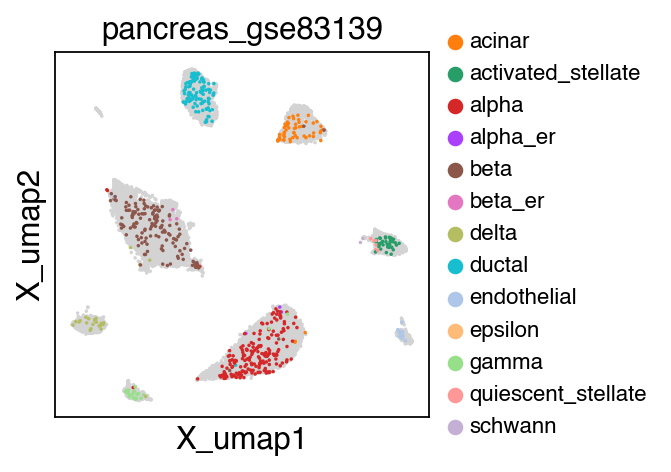
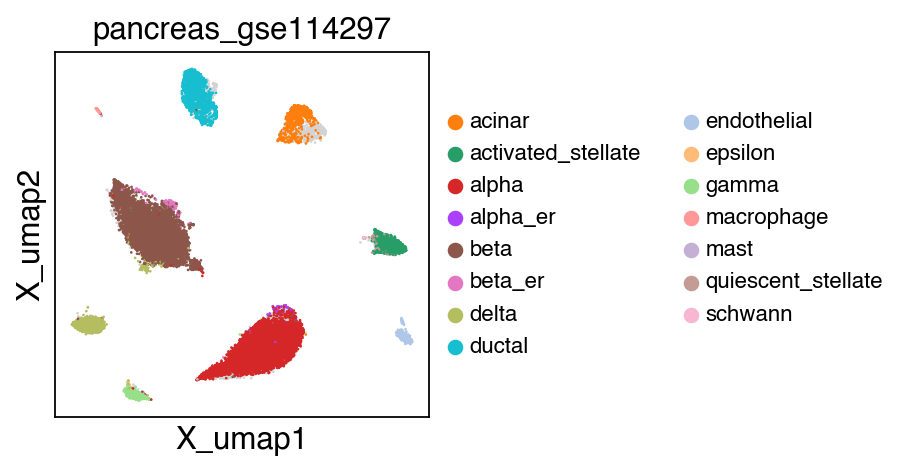
sc.pl.umap(adata[adata.obs.batch.isin(['pancreas_gse114297','pancreas_gse81547','pancreas_gse83139'])],color='batch',legend_fontsize=10)
embedding(adata[adata.obs.batch.isin(['pancreas_gse114297','pancreas_gse81547','pancreas_gse83139'])],legend_fontsize=10)
Trying to set attribute `.uns` of view, copying.
Trying to set attribute `.obs` of view, copying.
The projection results is stored as adata.h5ad in the output directory assigned by outdir parameter in SCALE function.
Label transfer
We can also use SCALEX to transfer data from one dataset to another. Here, we demonstrate data transfer between two scRNA-seq datasets by transferring the cell type label from the adata_ref and the adata_query.
[25]:
adata_query=adata[adata.obs.projection=='query']
adata_query
[25]:
View of AnnData object with n_obs × n_vars = 23744 × 2000
    obs: 'batch', 'celltype', 'disease', 'donor', 'library', 'protocol', 'n_genes', 'leiden', 'projection'
    var: 'n_cells-reference', 'highly_variable-reference', 'means-reference', 'dispersions-reference', 'dispersions_norm-reference', 'highly_variable_nbatches-reference', 'highly_variable_intersection-reference'
    uns: 'neighbors', 'umap', 'leiden'
    obsm: 'latent', 'X_umap'
    obsp: 'distances', 'connectivities'
[26]:
adata_ref=adata[adata.obs.projection=='reference']
adata_ref
[26]:
View of AnnData object with n_obs × n_vars = 15277 × 2000
    obs: 'batch', 'celltype', 'disease', 'donor', 'library', 'protocol', 'n_genes', 'leiden', 'projection'
    var: 'n_cells-reference', 'highly_variable-reference', 'means-reference', 'dispersions-reference', 'dispersions_norm-reference', 'highly_variable_nbatches-reference', 'highly_variable_intersection-reference'
    uns: 'neighbors', 'umap', 'leiden'
    obsm: 'latent', 'X_umap'
    obsp: 'distances', 'connectivities'
[27]:
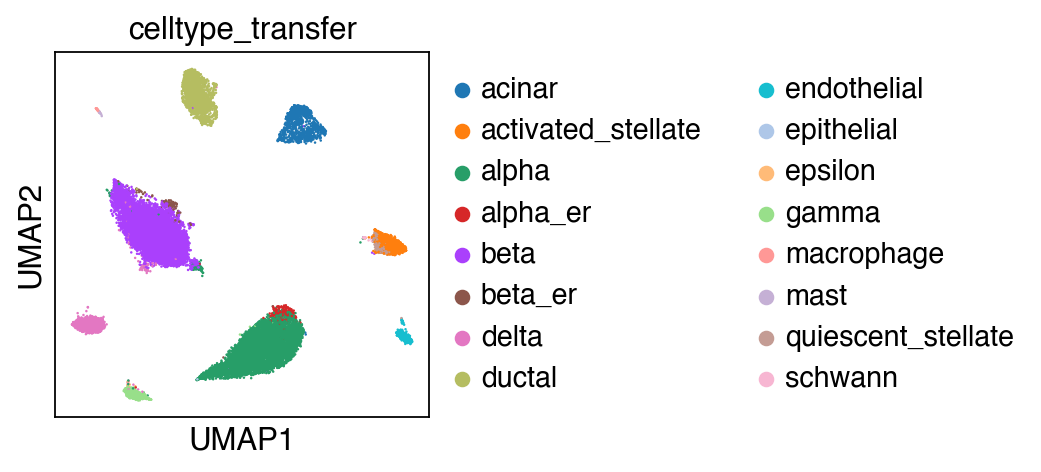
adata_query.obs['celltype_transfer']=label_transfer(adata_ref, adata_query, rep='latent', label='celltype')
Trying to set attribute `.obs` of view, copying.
[28]:
sc.pl.umap(adata_query,color=['celltype_transfer'])
... storing 'celltype_transfer' as categorical
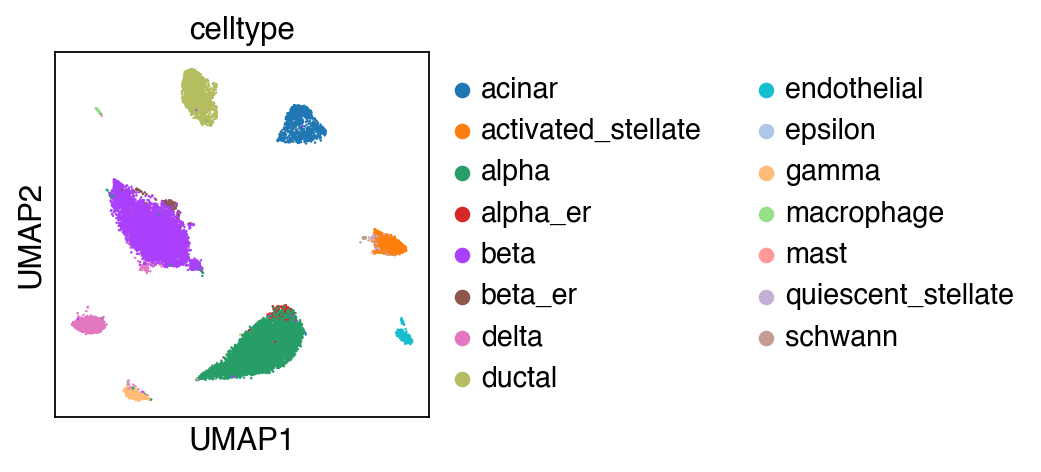
[29]:
sc.pl.umap(adata_query,color=['celltype'])
Let us first focus on cell types that are conserved with the reference.
[30]:
obs_query = adata_query.obs
conserved_categories = obs_query.celltype.cat.categories.intersection(obs_query.celltype_transfer.cat.categories)  # intersected categories
obs_query_conserved = obs_query.loc[obs_query.celltype.isin(conserved_categories) & obs_query.celltype_transfer.isin(conserved_categories)]  # intersect categories
obs_query_conserved.celltype.cat.remove_unused_categories(inplace=True)  # remove unused categoriyes
obs_query_conserved.celltype_transfer.cat.remove_unused_categories(inplace=True)  # remove unused categoriyes
obs_query_conserved.celltype_transfer.cat.reorder_categories(obs_query_conserved.celltype.cat.categories, inplace=True)  # fix category ordering
pd.crosstab(obs_query_conserved.celltype, obs_query_conserved.celltype_transfer)
[30]:
| celltype_transfer | acinar | activated_stellate | alpha | alpha_er | beta | beta_er | delta | ductal | endothelial | epsilon | gamma | macrophage | mast | quiescent_stellate | schwann |
|---|---|---|---|---|---|---|---|---|---|---|---|---|---|---|---|
| celltype | |||||||||||||||
| acinar | 1346 | 0 | 3 | 0 | 3 | 0 | 0 | 2 | 0 | 0 | 0 | 0 | 0 | 1 | 0 |
| activated_stellate | 0 | 1033 | 0 | 0 | 2 | 0 | 0 | 0 | 0 | 0 | 0 | 0 | 0 | 119 | 1 |
| alpha | 2 | 0 | 7527 | 83 | 13 | 0 | 3 | 0 | 0 | 0 | 11 | 0 | 1 | 0 | 0 |
| alpha_er | 0 | 0 | 159 | 105 | 2 | 1 | 0 | 0 | 0 | 0 | 0 | 0 | 0 | 0 | 0 |
| beta | 3 | 0 | 119 | 4 | 8683 | 34 | 17 | 1 | 0 | 0 | 3 | 0 | 0 | 0 | 0 |
| beta_er | 0 | 0 | 0 | 0 | 41 | 56 | 0 | 1 | 0 | 0 | 0 | 0 | 0 | 0 | 0 |
| delta | 1 | 0 | 8 | 0 | 34 | 0 | 1099 | 0 | 0 | 1 | 6 | 0 | 0 | 0 | 0 |
| ductal | 2 | 0 | 3 | 0 | 2 | 0 | 3 | 1889 | 0 | 0 | 0 | 0 | 0 | 0 | 0 |
| endothelial | 0 | 1 | 0 | 0 | 1 | 0 | 1 | 0 | 456 | 0 | 0 | 0 | 0 | 1 | 0 |
| epsilon | 1 | 0 | 0 | 0 | 0 | 0 | 3 | 0 | 0 | 10 | 3 | 0 | 0 | 0 | 0 |
| gamma | 0 | 0 | 7 | 2 | 3 | 0 | 1 | 0 | 0 | 2 | 578 | 0 | 0 | 0 | 0 |
| macrophage | 0 | 0 | 0 | 0 | 0 | 0 | 0 | 0 | 0 | 0 | 0 | 58 | 14 | 0 | 0 |
| mast | 1 | 0 | 0 | 0 | 1 | 0 | 0 | 0 | 0 | 0 | 0 | 3 | 6 | 0 | 0 |
| quiescent_stellate | 0 | 53 | 0 | 0 | 2 | 0 | 0 | 0 | 0 | 0 | 0 | 0 | 0 | 68 | 1 |
| schwann | 1 | 0 | 2 | 0 | 0 | 1 | 0 | 0 | 0 | 0 | 0 | 0 | 0 | 0 | 34 |
Let us now move on to look at all cell types.
[31]:
pd.crosstab(adata_query.obs.celltype, adata_query.obs.celltype_transfer)
[31]:
| celltype_transfer | acinar | activated_stellate | alpha | alpha_er | beta | beta_er | delta | ductal | endothelial | epithelial | epsilon | gamma | macrophage | mast | quiescent_stellate | schwann |
|---|---|---|---|---|---|---|---|---|---|---|---|---|---|---|---|---|
| celltype | ||||||||||||||||
| acinar | 1346 | 0 | 3 | 0 | 3 | 0 | 0 | 2 | 0 | 0 | 0 | 0 | 0 | 0 | 1 | 0 |
| activated_stellate | 0 | 1033 | 0 | 0 | 2 | 0 | 0 | 0 | 0 | 0 | 0 | 0 | 0 | 0 | 119 | 1 |
| alpha | 2 | 0 | 7527 | 83 | 13 | 0 | 3 | 0 | 0 | 1 | 0 | 11 | 0 | 1 | 0 | 0 |
| alpha_er | 0 | 0 | 159 | 105 | 2 | 1 | 0 | 0 | 0 | 0 | 0 | 0 | 0 | 0 | 0 | 0 |
| beta | 3 | 0 | 119 | 4 | 8683 | 34 | 17 | 1 | 0 | 0 | 0 | 3 | 0 | 0 | 0 | 0 |
| beta_er | 0 | 0 | 0 | 0 | 41 | 56 | 0 | 1 | 0 | 0 | 0 | 0 | 0 | 0 | 0 | 0 |
| delta | 1 | 0 | 8 | 0 | 34 | 0 | 1099 | 0 | 0 | 0 | 1 | 6 | 0 | 0 | 0 | 0 |
| ductal | 2 | 0 | 3 | 0 | 2 | 0 | 3 | 1889 | 0 | 0 | 0 | 0 | 0 | 0 | 0 | 0 |
| endothelial | 0 | 1 | 0 | 0 | 1 | 0 | 1 | 0 | 456 | 0 | 0 | 0 | 0 | 0 | 1 | 0 |
| epsilon | 1 | 0 | 0 | 0 | 0 | 0 | 3 | 0 | 0 | 0 | 10 | 3 | 0 | 0 | 0 | 0 |
| gamma | 0 | 0 | 7 | 2 | 3 | 0 | 1 | 0 | 0 | 0 | 2 | 578 | 0 | 0 | 0 | 0 |
| macrophage | 0 | 0 | 0 | 0 | 0 | 0 | 0 | 0 | 0 | 0 | 0 | 0 | 58 | 14 | 0 | 0 |
| mast | 1 | 0 | 0 | 0 | 1 | 0 | 0 | 0 | 0 | 1 | 0 | 0 | 3 | 6 | 0 | 0 |
| quiescent_stellate | 0 | 53 | 0 | 0 | 2 | 0 | 0 | 0 | 0 | 0 | 0 | 0 | 0 | 0 | 68 | 1 |
| schwann | 1 | 0 | 2 | 0 | 0 | 1 | 0 | 0 | 0 | 0 | 0 | 0 | 0 | 0 | 0 | 34 |